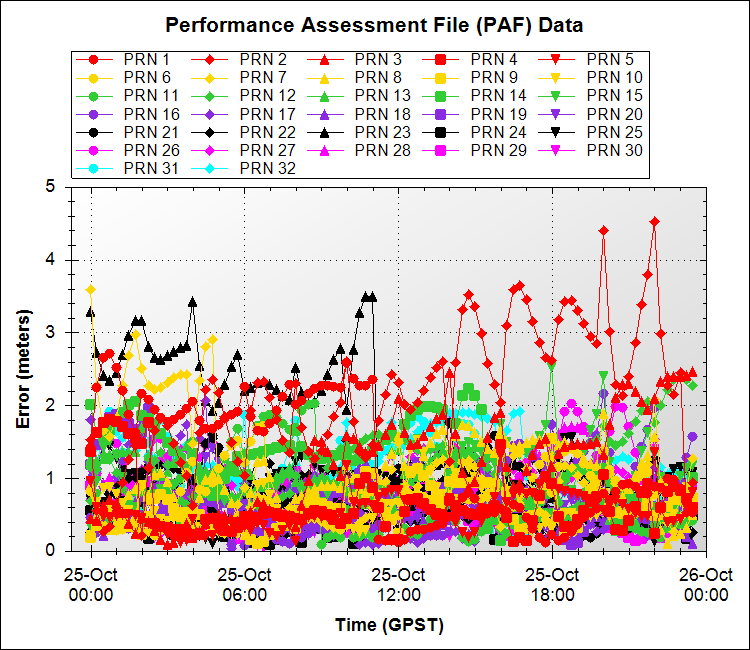
GPS Performance Assessment File (PAF) and Prediction Support File (PSF) data are created daily
by AGI and placed on our FTP servers. This plots on this page help to visualize and understand GPS
constellation error behaviors. The GPS constellation exhibits errors in its ephemeris
(position in space) and clock data that translate into positioning errors in GPS receivers.
These plots represent the PAF and PSF data available from:
For both graphs, the days are listed as JJJ:MM/DD/YYYY, where JJJ is the julian day, MM is the month, DD is the day of the month and YYYY is the year.
Performance Assessment File (PAF) Data
The PAF data is created by gathering the truth ephemeris and clock
information (in .SP3 format) for a given day and differencing
that data from the propagated broadcast ephemeris and clock information provided
in the RINEX navigation file for the same day. Both the SP3 and the RINEX
navigation files are produced by the National Geospatial-Intelligence Agency (NGA).
The antenna phase center SP3 file is used to calculate the ephemeris and clock truth data.
For the PAF file graph, select which type of data to view, which
PRNs to view (selecting multiple allowed) and which year and date to view (selecting
multiple dates within a year allowed). Click the update graphs button to see
the data. The initial view of the PAF data contains ephemeris errors for all PRNs
for the latest day data is available. Note that each PRN will have it's
own color and symbol regardless of how many PRNs are plotted. For example,
PRN 3 will always be a red triangle
 .
.
